
ADWISE Advanced Column
ADWISE Advanced Column for Microsoft Power BI
Brand new visual from ADWISE!
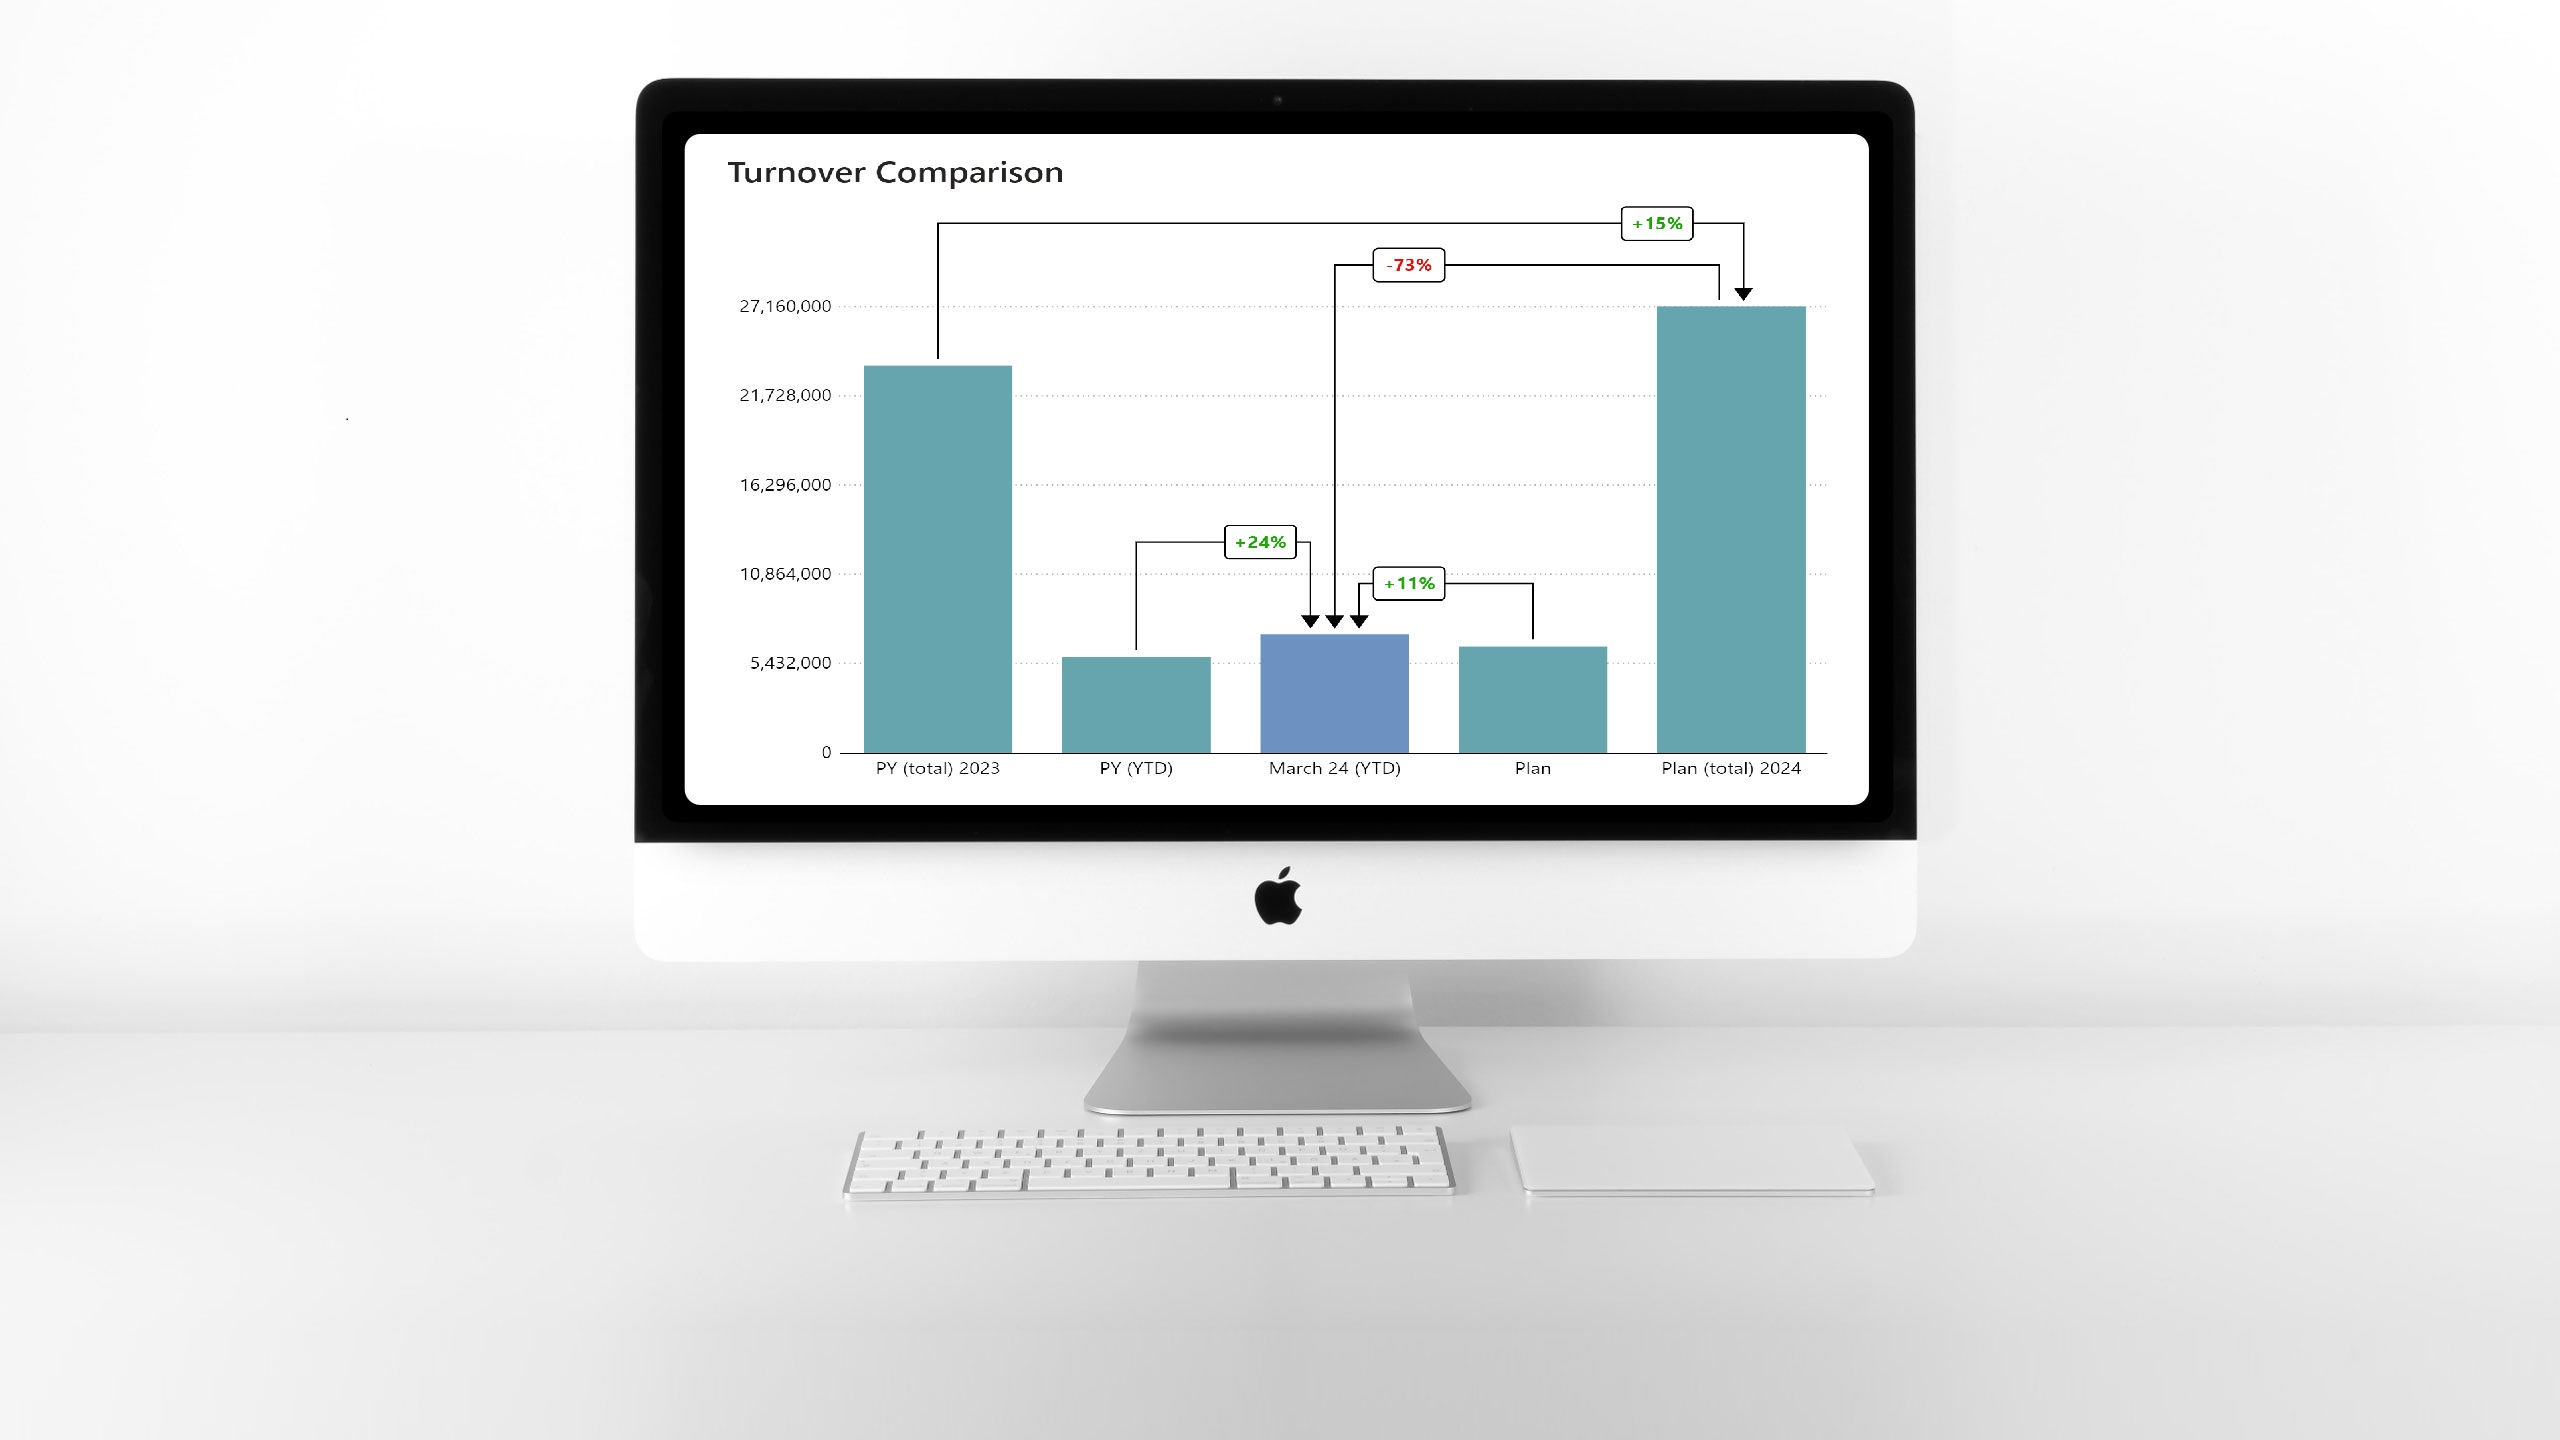
Advanced Column is easy to use column chart for comparing one or more values with clearly interpretable difference lines. It is best suited for comparison of values between time periods, categories or quantities. As usual with our visuals, you can apply multiple formatting options to render the visual the way you want, to be easily readeable for users and to correspond with your corporate identity.
The visual is based on a long-term experience of our consultants who have designed hundreds of management and analytical reports for companies of all sizes.
Can be used as complement to our highly succesful ADWISE RoadMap / Gantt visual.
Usage
Values/categories comparison
Platform
Microsoft Power BI
Microsoft Certification
Power BI certified
Download
Sample files
Advanced Column (.pbix) | Dataset (.xlsx)
Support
Column chart with Difference lines
Advanced Column let's you use all the standard features of column chart such as Axis X, Y formatting, gridlines, values + totals, legend and so on, but with the ability to compare any columns with "drag & drop" simplicity.
Additional config options: Difference lines – configurable lines to clearly show compared columns / Values – show difference in percentage or absolute values or both / Shapes - you can choose from rectangle, circle or ellipse with configurable positioning / Positive/negative difference – distinguish differences with colors and symbols to be readily idetifiable by users / Series labels – use changing labels for Axis X, e.g. when you use calendar months for column names / Series formatting – format data and total labels per category (legend) / And other formatting - thousand and decimal separator, interaction with other visuals, empty data screen, ...
Pricing plans
For 30 days you can try the visual out free of charge with full functionality. Afterwards, licenses are available for purchase for particular number of report creators/designers. No additional licenses are required for users viewing the reports.
Live Web Demo
Take a look live at the demo file to see visual right away without downloading anything.
Trial
Our visual can be tried out for free for the period of 30 days. To get your license key for the trial period, only your email is needed.
Enterprise license subscription
Individual offers for corporate clients using MS Power BI Pro / Premium / Report Server / Embedded. Contact us for requesting a price offer.
Support
FAQs | License terms | Privacy Policy | ChangeLog (EN) | Contact form